
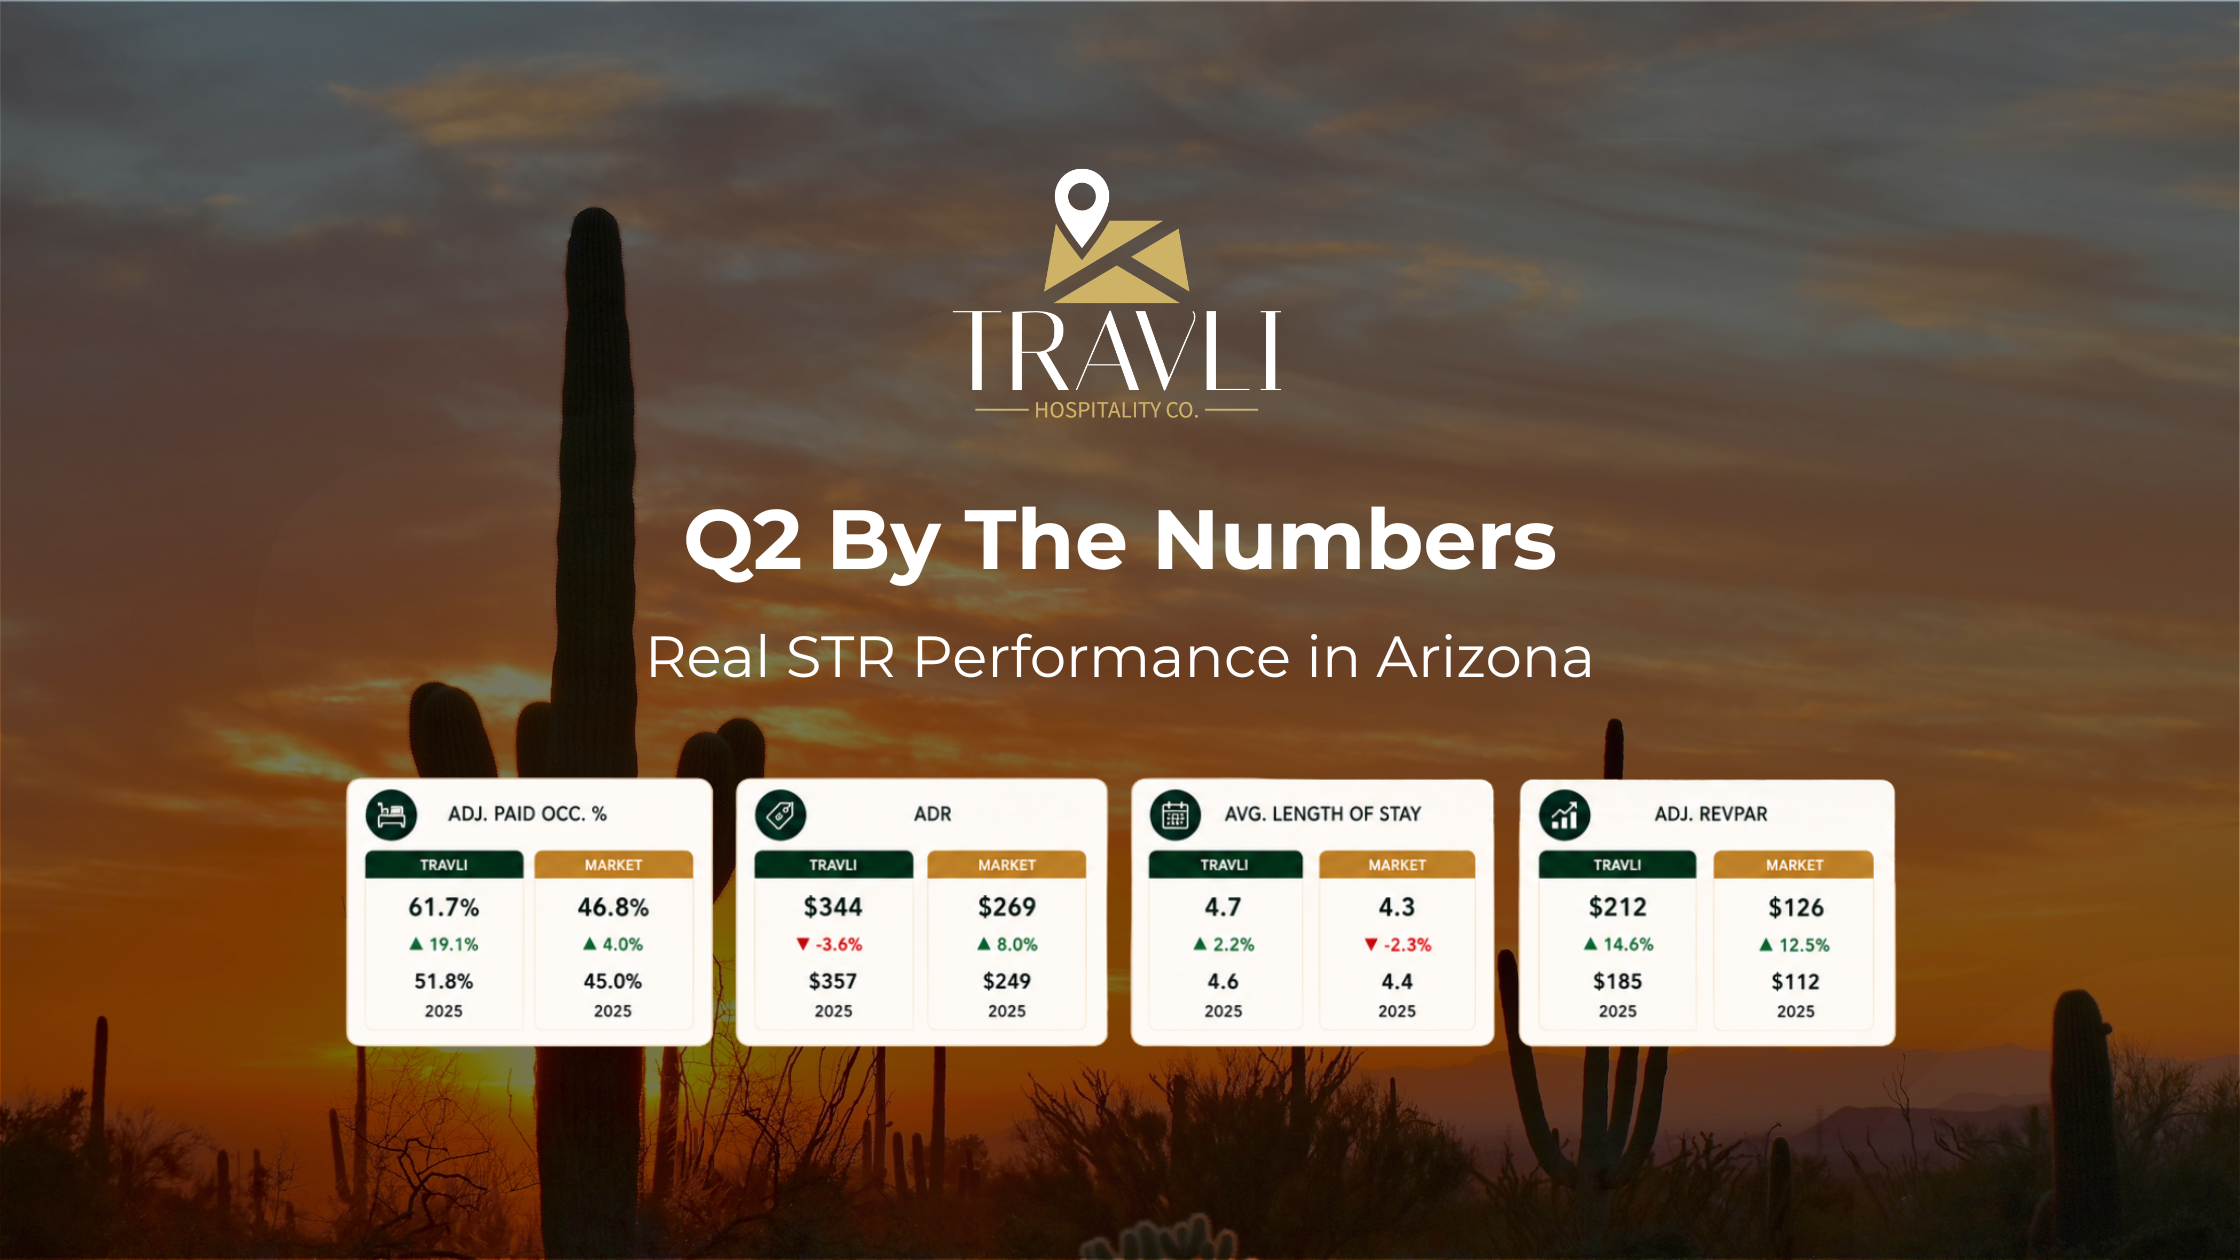

Q2 By The Numbers: Real STR Performance in Arizona
In the short-term rental space, bold promises are everywhere. “We’ll increase your revenue by 20%.” “We’ll boost your occupancy by 30%.” “We’ll outperform your current manager — guaranteed.” The reality? Most of these claims are made without ever analyzing your property, your positioning, or your market dynamics. At Travli Hospitality Co., we take a different approach. This is a real look at Arizona short-term rental performance for Q2 2026 — not another inflated promise. We don’t lead with promises. We lead with data.
Q2 2026: Travli Arizona Performance vs. The Market
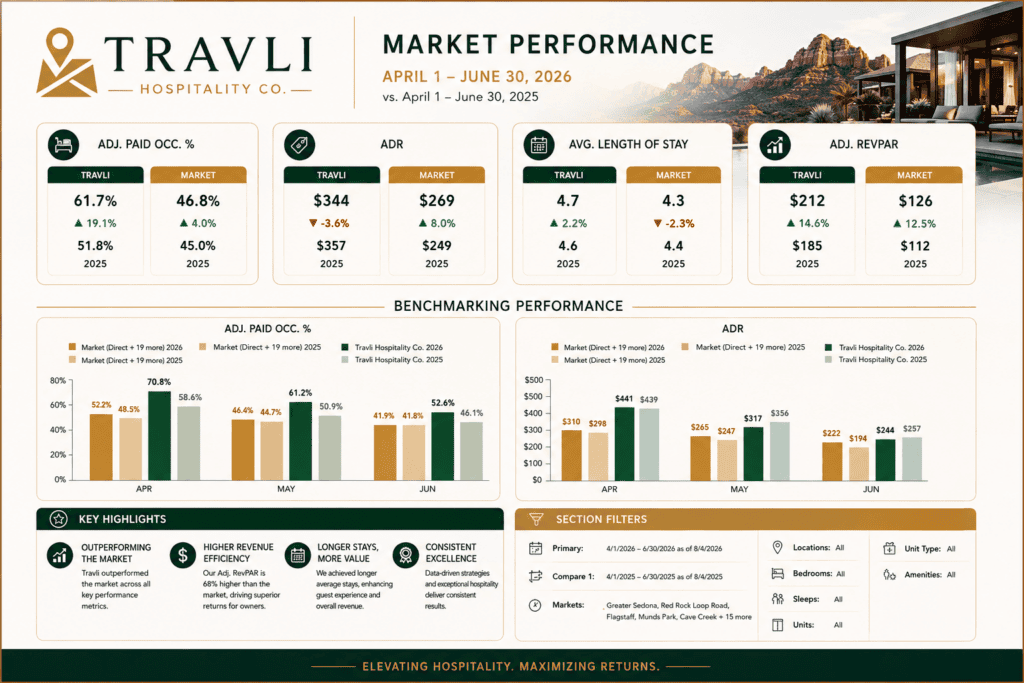
Below is a transparent breakdown of our actual Q2 2026 performance (April 1 – June 30), benchmarked directly against the broader Arizona market using verified data from Key Data Dashboard — the industry leader in short-term rental analytics. This compares Travli’s Arizona short-term rental performance against the statewide market average for the same period, year over year.
This isn’t a projection. This is executed performance at scale, across the entire Arizona portfolio.

The Real Story: Why RevPAR Matters More Than Occupancy or Rate Alone
We’re not going to bury the one number that moved against us. Travli’s average daily rate was down 3.6% year over year in Q2, while the market’s ADR climbed 8%. Reported alone, that looks like a step backward. It isn’t — but it deserves an honest explanation rather than a highlight reel.
Here’s what actually happened: Travli’s occupancy grew nearly five times faster than the market’s (+19.1% vs. +4.0%). That’s a deliberate trade-off, not an accident — a modest pullback from an unusually high rate premium last year (Travli’s ADR sat 43% above market in Q2 2025) in exchange for meaningfully higher booking volume. Even after that adjustment, Travli’s ADR still sits 28% above the market average today.
RevPAR — revenue per available night — is the metric that actually settles the question, because it captures both occupancy and rate at once. Travli’s RevPAR grew faster than the market’s (+14.6% vs. +12.5%) and sits 68% above the market average in absolute dollars. Occupancy or ADR in isolation can each tell a partial story. RevPAR is the one that reflects what a property actually earned.
The monthly data backs this up. Travli’s occupancy beat the market by roughly 18–20 percentage points in every single month of the quarter — 70.8% vs. 52.2% in April, 61.2% vs. 46.4% in May, and 52.6% vs. 41.9% in June. Guests are also staying slightly longer at Travli-managed properties (4.6 to 4.7 nights) while the broader market trend is shrinking (4.4 to 4.3 nights) — a small but real signal in a market where shorter average stays are becoming the norm.
What This Data Actually Means
Every property is different. Results vary based on location, design, amenities, and condition. But here’s the key takeaway: “the market” includes everyone — every host, every manager, every listing competing in the same category. That is the real measure of Arizona short-term rental performance: when Travli outperforms the market, it isn’t outperforming weak operators. It’s outperforming the entire ecosystem.
Why Most Managers Fall Short
Most underperformance in this industry comes down to the same three things, quarter after quarter:
- Overpromising to win the deal. Inflated revenue projections that don’t reflect real demand curves.
- Static pricing models. Set-it-and-forget-it pricing that ignores booking pace, seasonality, and shifting demand.
- Lack of operational control. Outsourced cleaning, maintenance, and guest experience that creates inconsistency — and kills reviews.
How Travli Approaches It Differently
- Data-driven revenue management. Pricing decisions are based on booking pace, demand compression, and conversion behavior, tracked continuously rather than set once and left alone.
- Full-service, in-house operations. Cleaning, maintenance, and pool service are vertically integrated rather than outsourced — see how that works in practice in our breakdown of Travli’s in-house vendor network.
- Market-specific strategy. Scottsdale isn’t Sedona, and luxury isn’t mid-tier — every property gets a positioning strategy suited to its actual market.
- Conversion-focused marketing. Listing optimization and pricing psychology designed to maximize both visibility and bookings, not just one or the other.
The Bottom Line
Anyone can promise better results. Very few will show you the real, verified data — including the parts that need context, like an ADR figure that moved against us this quarter. At Travli, we don’t need inflated proformas or hypothetical projections. We have the numbers, and we’re willing to explain the ones that aren’t purely flattering. For a longer view of how this quarter fits into the year, see our Q1 By The Numbers breakdown and our Travli vs. The Market analysis.
Frequently Asked Questions
In Q2 2026 (April–June), Travli’s occupancy was 61.7% against a statewide Arizona market average of 46.8% — 19.1% higher than the market.
Travli’s average daily rate declined 3.6% year over year in Q2, while the market’s ADR rose 8%. This reflects a narrowing of an unusually large rate premium from the prior year in exchange for a much larger occupancy gain — Travli’s ADR still sits 28% above the current market average.
RevPAR (revenue per available night) captures both occupancy and rate together, making it the clearest single measure of what a property actually earned. Travli’s Q2 2026 RevPAR was $212 versus a market average of $126 — 68% higher — and grew faster than the market year over year (+14.6% vs. +12.5%).
This data comes from Key Data Dashboard, an independent short-term rental analytics platform, comparing Travli’s Arizona portfolio performance against the broader Arizona market average for the same April–June period.
Guests stayed an average of 4.7 nights at Travli-managed properties in Q2 2026, up slightly from 4.6 nights a year earlier — while the broader Arizona market trend moved in the opposite direction, shrinking from 4.4 to 4.3 nights.
Thinking about making a change? If you’re currently self-managing, or working with a manager delivering “average” results, it may be time to see what your property is actually capable of.
Related Reading
Own a short-term rental in the area? Travli offers full-service Arizona vacation rental management, handling everything from dynamic pricing to in-house cleaning and round-the-clock guest care.
